Started on AI for assessment 2.
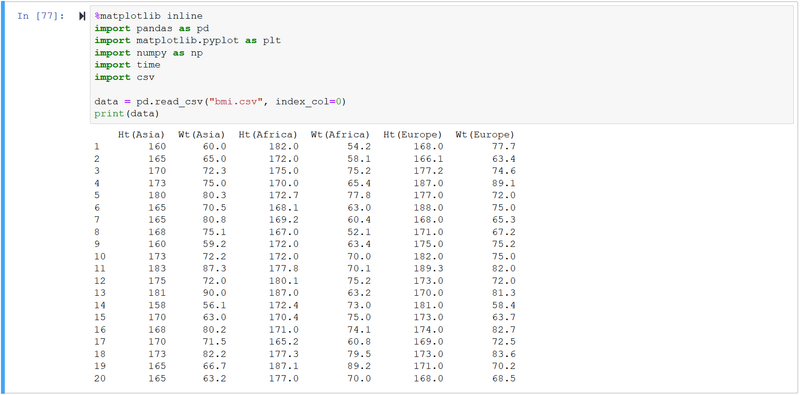
Firstly, using panda to have a visualization of the data that is in the csv file.
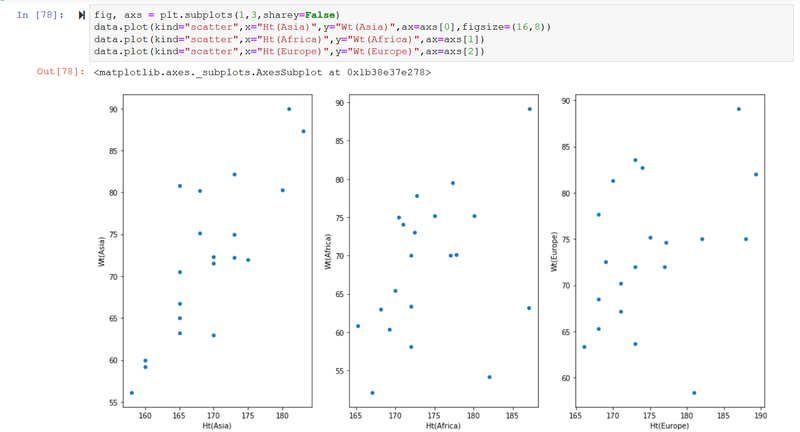
Plotting a scatter graph with the help of matlibplot.
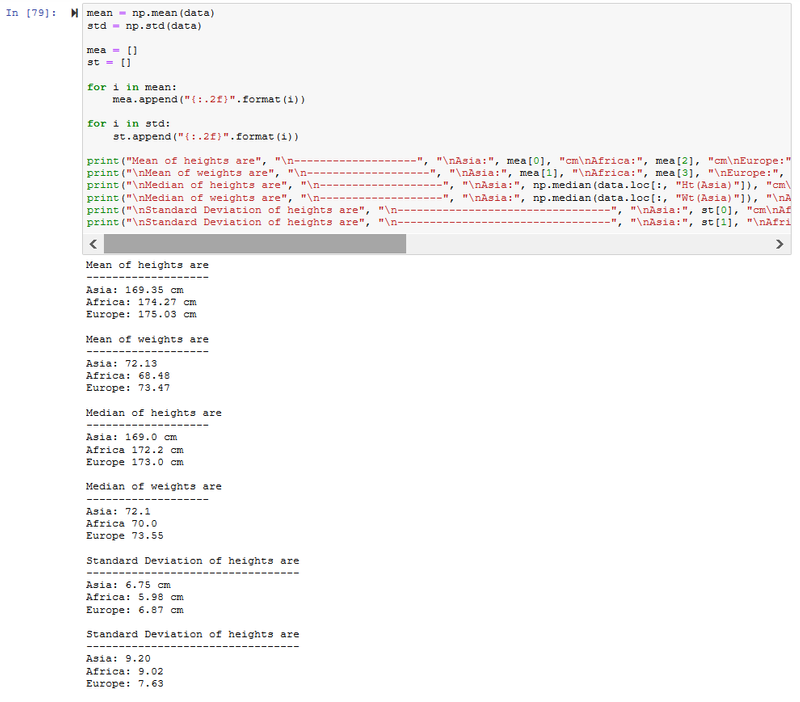
Printing of relevant data, namely mean, median and standard deviation of the data using numpy.
Linear regression using numpy by first calculating or the variance, covariance, alpha and beta. As well as prediction of a given height to find the weight.
Proceeding to the plotting of the graph using matplotlib. With linear regression to find a predictive line as well as point the location of the given height.
(Updated: )